


 |
 |
 |
 |
 |
 |
|
Do you have any information or materials to share about this period of Lakewood Villages history? Heres how to help with this history project. |
Coming soon...
News and Events
|
Year |
Month |
News / Event |
|
1990 |
|
|
|
1991 |
October |
The Lakewood Village Neighborhood Association (LVNA) was formed, with a similar form and purpose to its predecessor, the Lakewood Village Residents Association (LVRA) which had been in operation from 1958 until the mid 1970s. |
|
1992 |
April |
A six-month cooperative improvement program called Partners was started. City workers and residents planted 150 new tress, removed rubbish, cleaned up graffiti, replaced street lights, and repaired sidewalks as part of the program. |
|
June |
A polluted aquifer plume from Advanced Micro Devices, TRW, and Signetics, was found to end at Lakefair Drive, but was not considered to pose a danger to Lakewood Village residents, in part because it was 40 to 55 feet underground. |
|
|
November |
Sunnyvale City Council approved a master plan for improvements to Fairwood Park and the adjoining Fairwood School playground and Hetch-Hetchy right-of-way. |
|
|
1993 |
May |
150 artists painted a mural for Lakewood Village |
|
July |
Giovannis Pizzeria opened in Dicks Lakewood Center |
|
|
September |
The Filipino-American Association of Lakewood Village donated a bus shelter on Lakehaven near Velvetlake. The shelter is still in use by appreciative bus riders today. |
|
|
1994 |
February |
Lakewood Village residents appeared before the Sunnyvale City Council to voice concerns about increased traffic resulting from the planned Mercado shopping mall. |
|
August |
The Mercado shopping mall plans were approved by the Santa Clara City Council after its developer agreed to pay for traffic signals at Wildwood and Lawrence Expressway. (The signal light was never constructed and continues to be an issue). |
|
|
September |
Sunnyvale City Council approved construction costs for improvements to Fairwood Park and adjoining public areas. |
|
|
November |
Sunnyvale City Council began talks with the Santa Clara Valley Water District and the City of Santa Clara to explore access to the Calabazas Creek Trail from Lakewood Village. (Plans were not finalized or funded until 2003) |
|
|
1995 |
July |
The LVNA Villager published a list of the ten Lakewood Village homes, five considered to be the most well kept and five considered to be ugly. Controversy arose when it was found that the ugliest home, on Twinlake Drive, was owned by 40-year residents who were dying, and both had died in the month before publication. An outpouring of donations to fix up the property were gratefully received by the owners adult children, who had been living there to care for their dying parents. |
|
1996 |
May |
Lakewood Village resident Eugene Goldsmith is among the five Sunnyvale residents chosen to carry the Olympic Torch through the city on its way to Atlanta. Eugene was well known in the neighborhood for his daily efforts to clean up graffiti. |
|
1997 |
January |
The City of Sunnyvale approved plans for renovating of Dicks Lakewood Shopping Center. |
|
September |
Fairwood Elementary School reopens. |
|
|
November |
Lakewood resident, and President of the LVNA, Frederik Fowler was elected to Sunnyvales City Council. |
|
|
1998 |
February |
Traffic changes were made around the Mercado shopping center to encourage drivers to use Great America Parkway for access instead of using Wildwood and other streets through Lakewood Village. |
|
1999 |
|
|
Neighborhood Profile
Census and demographic data can be difficult to obtain, and when it is available, it often is not in a consistent form from one set of data to the next. Here is what I have been able to obtain about Lakewood Village in the 1990s:
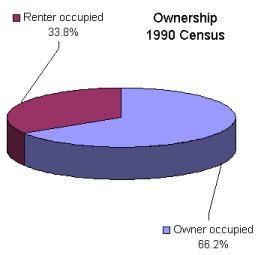
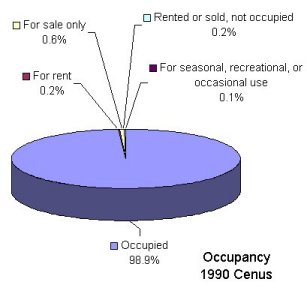
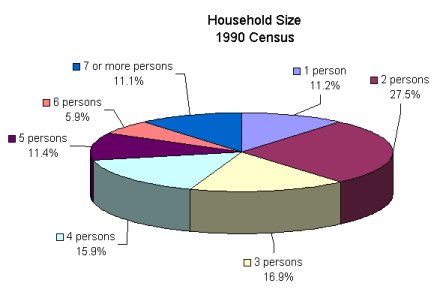
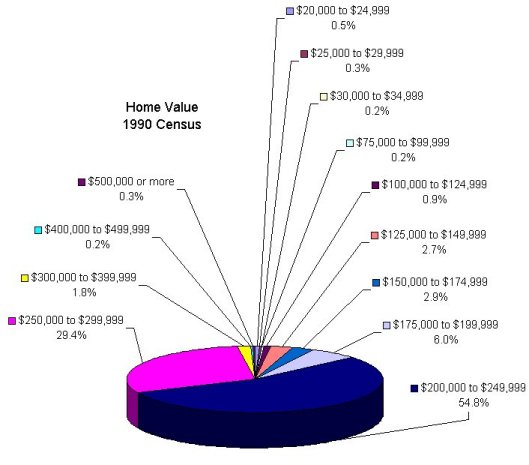
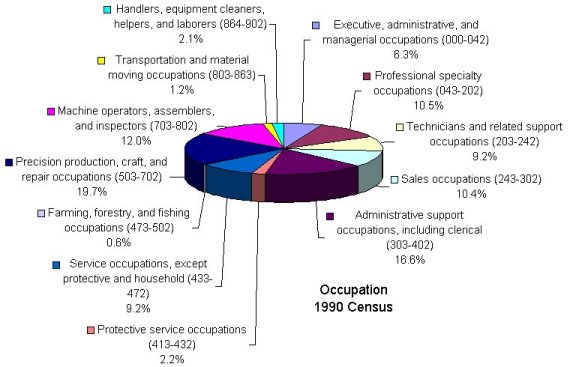
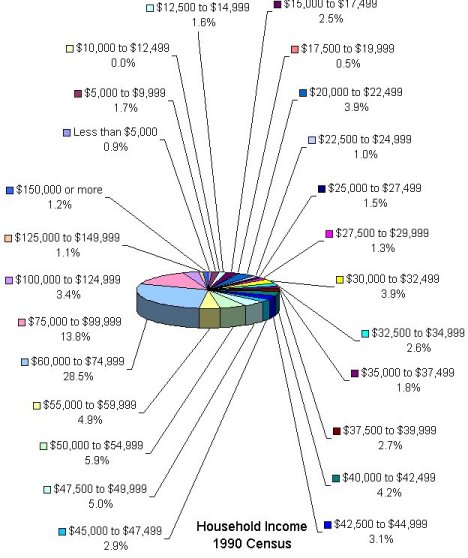
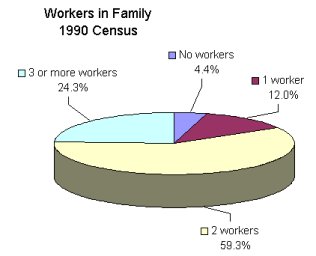
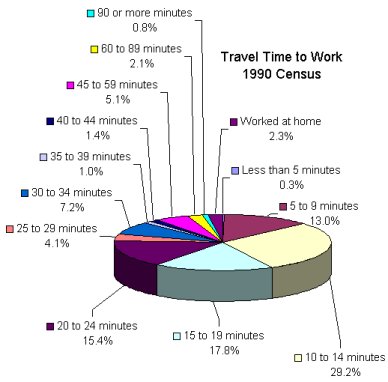
1990 Census Data (at Block Group level)
The following charts are from the US Census Bureau data for 1999. Data is available down to the block group level within a census tract (see the Census Tract Map for definitions). Block groups in the Lakewood Village area correspond nicely with Lakewood Villages units, with one exception: the block group that contains Unit 1 also contains The Arches apartment complex, and the presence of those apartment dwellers in the data set significantly alters the size and makeup of the population in that area. For that reason, I have charted only units 2, 3, and 4.
For a comparison of 1990 and 2000 data, see the Census page.
Homes
People
Work
![]()
The complete data from which these charts were derived is available in a large Excel spreadsheet. This spreadsheet has data for the individual block groups, totals with and without unit 1, and comparison data for the city of Sunnyvale as a whole. The spreadsheet also contains similar data from the 1990 census, and a table which compares similar data from 1990 and 2000.
Or, if you prefer, you can obtain the raw data from the US Census Bureau at their FactFinder web site.
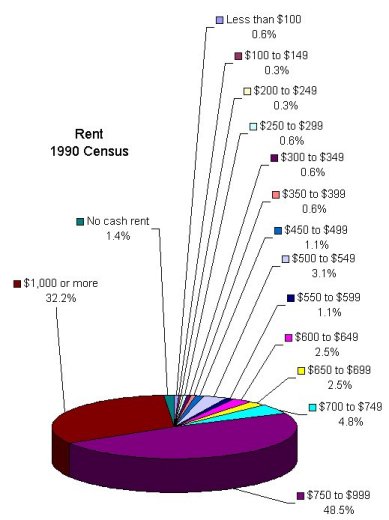
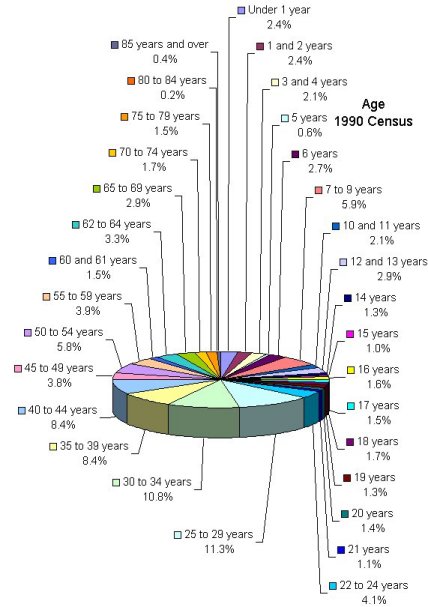
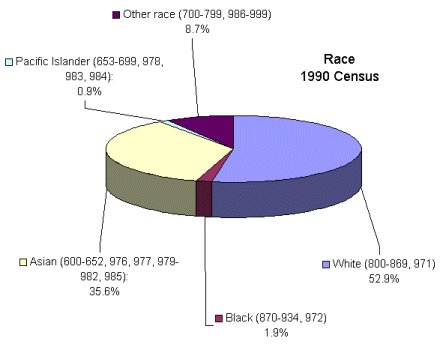
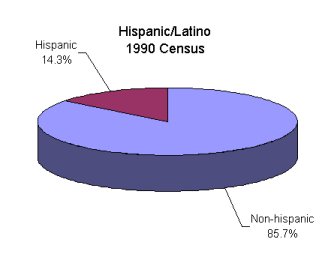
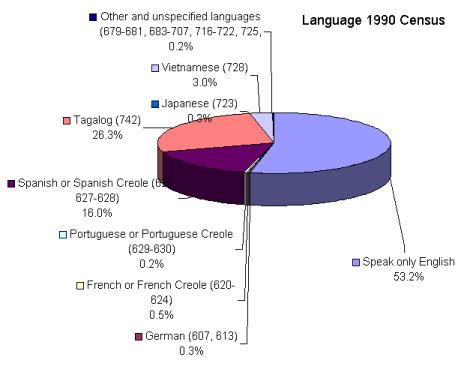
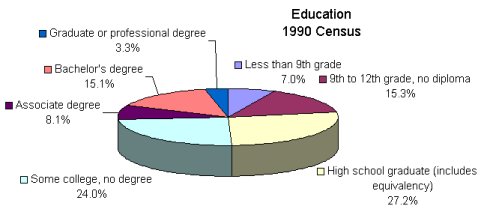
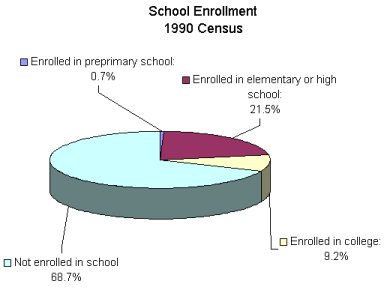
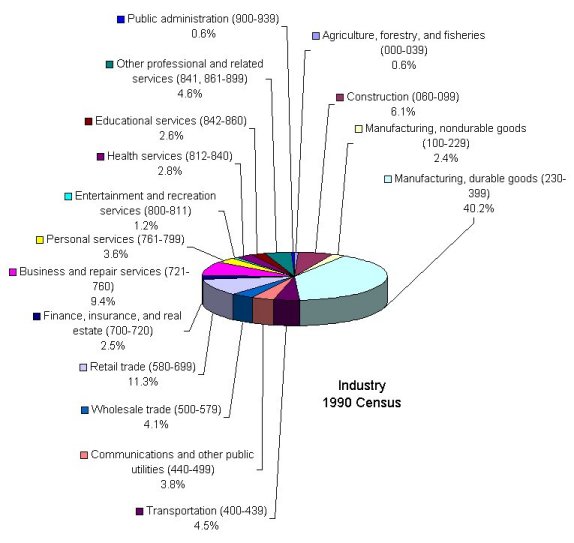
1990 Census Data (for 1990 Census Tracts 5048.02 and 5048.04)
This data set represents the area bounded by Calabazas Creek to the east, CA Route 237 to the north, Fair Oaks Avenue to the west, and US Highway 101 to the south. In other words, it covers Lakewood Village, The Arches apartment complex, the mobile home parks to the north and east, and the light industrial area to the north. The data from which this table was extracted is available in an Excel spreadsheet. It was obtained from FreeDemographics.com and has comparative data for 1970 and 1980.
For more data and comparisons with 1970, 1980, and 2000 Census Data, look at the Census Page.
|
||||||||||||||||||||||||||||||||||||||||||||||||||||||||||||||||||||||||||||||||||||||||||||||||||||||||||||||||||||||||||||||||||||||||||||


[Lakewood Village] [The LVNA Villager] [Events and Activities] [The LVNA] [Resources]
|
Copyright ©2002-2008 Brian Smithson |