|
|
Images and Galleries
News and Events
|
Year
|
Month
|
News / Event
|
|
1970
|
March
|
Library Bookmobile service starts. Stops are at Lakewood Park and at the Lakewood Village Methodist Church.
|
|
There were reports of problems with older kids bullying younger kids, shaking them down for lunch money, etc.
|
|
October
|
LVRA has a Spook House to celebrate Halloween.
|
|
1971
|
February
|
There were reports of repeated vandalism of the Holiday Inn.
|
|
Lakewood Village Cookbook feature begins in The Villager.
|
|
March
|
Easter Parade from Fairwood School to Lakewood Park culminates in an Easter Egg hunt at the park.
|
|
April
|
Lakewood Shell begins 24-hour service.
|
|
May
|
Proposed construction of a slaughterhouse near Lakewood Village is stopped as the result of a concerted three-day effort involving some 350 people.
|
|
June
|
Hetch-Hetchy right-of-way has recurring weed problems; problems are reported when weed abatement results in damaging the landscaping on adjacent properties.
|
|
1972
|
|
|
|
1973
|
|
|
|
1974
|
|
|
|
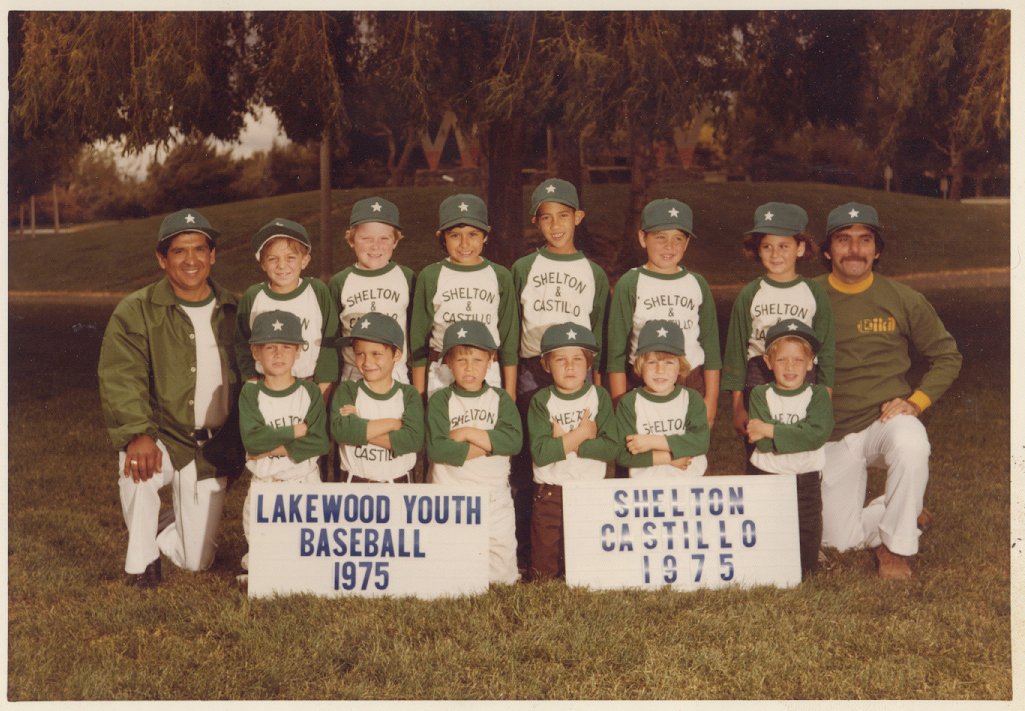
1975
|
|
|
|
1976
|
|
|
|
1977
|
|
|
|
1978
|
|
|
|
1979
|
|
|
|
Neighborhood Profile
Census and demographic data can be difficult to obtain, and when it is available, it often is not in a consistent form from one set of data to
the next. Here is what I have been able to obtain about Lakewood Village in the 1970s:
1970 Census Data (for 1990 Census Tracts 5048.02 and 5048.04)
These data represent the area bounded by Calabazas Creek to the east, CA Route 237 to the north, Fair Oaks Avenue to the west, and
US Highway 101 to the south. In other words, it covers Lakewood Village, The Arches apartment complex, the mobile home parks to the north and east, and the light industrial area to the north. The data
from which this table was extracted is available in an Excel spreadsheet. It was obtained from FreeDemographics.com and has comparative data for 1980 and 1990.
For comparisons with 1980, 1990, and 2000 Census Data, look at the Census Page.
|
1970 Census
|
|
Population Demographics:
|
|
Total Population
|
9,009
|
|
Total Households
|
2,708
|
|
Gender:
|
|
Male
|
4,509
|
50.00%
|
|
Female
|
4,500
|
50.00%
|
|
Population by Race/Ethnicity:
|
|
White
|
8,536
|
94.70%
|
|
Black
|
133
|
1.50%
|
|
American Indian/Eskimo
|
N/A
|
N/A
|
|
Asian/Pacific Islander
|
N/A
|
N/A
|
|
Other
|
340
|
3.80%
|
|
Hispanic Ethnicity
|
1,381
|
15.30%
|
|
Population by Age:
|
|
0 to 5
|
1,016
|
11.30%
|
|
6 to 13
|
1,783
|
19.80%
|
|
14 to 17
|
630
|
7.00%
|
|
18 to 24
|
733
|
8.10%
|
|
25 to 34
|
1,344
|
14.90%
|
|
35 to 44
|
1,114
|
12.40%
|
|
45 to 54
|
1,177
|
13.10%
|
|
55 to 64
|
766
|
8.50%
|
|
65 +
|
1,443
|
16.00%
|
|
Median Age
|
30.1
|
|
Households by Income:
|
|
$0 - $15,000
|
2,051
|
75.70%
|
|
$15,000 - $29,999
|
643
|
23.70%
|
|
$30,000 - $34,999
|
8
|
0.30%
|
|
$35,000 - $49,999
|
4
|
0.10%
|
|
$50,000 - $74,999
|
0
|
0.00%
|
|
$75,000 +
|
0
|
0.00%
|
|
Average Household Income
|
$11,030
|
|
Median Household Income
|
$10,795
|
|
Per Capita Income
|
$3,409
|
|
|